
Table of Contents
- Overview
- 1- Velocity: Unleashing Team Productivity
- 2- Sprint Burndown: Ensuring Timely Delivery
- 3- Lead Time and Cycle Time: Streamlining Workflow Efficiency
- 4- Cumulative Flow Diagram (CFD): Visualizing Workflow Dynamics
- 5- Backlog Health: Ensuring Prioritization and Alignment
- 6- Release Burndown: Tracking Progress Across Iterations
- Summary
In the fast-paced landscape of software development, Agile methodologies have become a cornerstone for organizations striving to stay adaptive and responsive. Success in Agile environments is not only about embracing iterative processes and collaboration but also about effectively measuring and optimizing performance. This article explores the crucial role of Key Performance Indicators (KPIs) in driving success within Agile teams and provides insights into essential metrics that can propel your projects towards excellence.
Glossary
KPI:
- KPI stands for key performance indicator.
- It is a means of measuring a team’s performance to ensure they are on track to hit their project objectives. [1]
Overview
Before we embark on a detailed exploration of each Key Performance Indicator (KPI), let’s first lay the foundation with a comprehensive list of these essential metrics. These KPIs serve as the guiding beacons for Agile teams, offering a holistic view of productivity, efficiency, and overall project health. Join us as we delve into the intricacies of Velocity, Sprint Burndown, Lead Time, Cycle Time, Cumulative Flow Diagrams, and Backlog Health, understanding how these metrics collectively drive success in Agile environments.
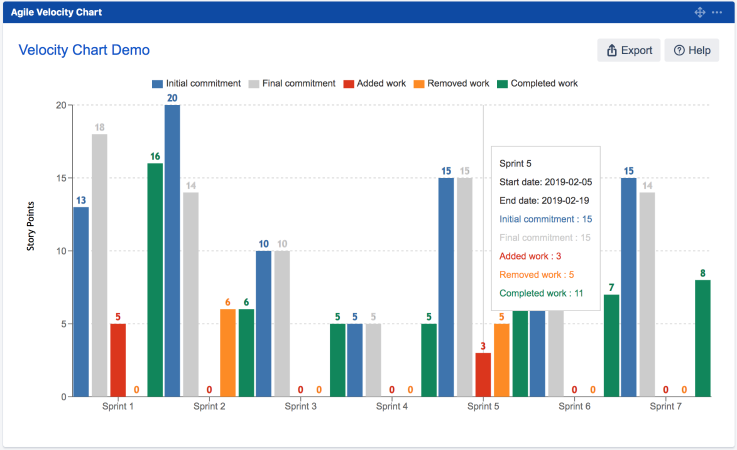
- Velocity: Unleashing Team Productivity Agile teams commonly measure their productivity through Velocity, a metric that quantifies the amount of work completed within a given time frame. This essential KPI allows teams to gauge their capacity and track consistent progress across sprints, providing valuable insights for planning future iterations.
- Sprint Burndown: Ensuring Timely Delivery Timely delivery is a hallmark of Agile success. Sprint Burndown charts visually represent the remaining work versus time during a sprint, offering teams a real-time view of their progress. This KPI aids in course correction, ensuring that the team stays on track to meet sprint goals.
- Lead Time and Cycle Time: Streamlining Workflow Efficiency Agile teams prioritize efficiency, and Lead Time and Cycle Time are critical KPIs in achieving this goal. Lead Time measures the end-to-end duration of a user story, from initiation to completion. Cycle Time, on the other hand, focuses on the time taken for active development. These metrics help teams identify bottlenecks, streamline processes, and enhance overall workflow efficiency.
- Cumulative Flow Diagram (CFD): Visualizing Workflow Dynamics A Cumulative Flow Diagram offers a visual representation of work items as they progress through different stages of the development process. This KPI helps teams identify trends, spot potential bottlenecks, and make data-driven decisions to optimize their workflow for greater agility.
- Backlog Health: Ensuring Prioritization and Alignment A well-managed product backlog is crucial for success. Backlog Health, as a KPI, encompasses factors like the number of items, prioritization, and grooming frequency. This metric ensures that the team is focused on delivering value by aligning their efforts with business priorities.
- Release Burndown: Tracking Progress Across Iterations For projects spanning multiple sprints or iterations, Release Burndown charts provide a comprehensive view of progress towards overarching goals. This KPI aids in managing expectations, making informed decisions, and ensuring a smooth transition from development to release.
1- Velocity: Unleashing Team Productivity
At the heart of this journey lies the key metric of “Velocity.” Understanding how to measure and interpret Velocity is essential for Agile teams seeking to optimize their performance and drive success.
1.1- Defining Velocity in Agile:
Before delving into measurement techniques, let’s establish a clear understanding of Velocity. In Agile terms, Velocity refers to the amount of work a team can complete within a specific time frame, often measured in story points or other agreed-upon units. It serves as a compass, guiding teams in assessing their capacity and setting realistic expectations for each sprint.
1.2- Story Points and Estimations:
One common approach to measuring Velocity is through the use of story points. Agile teams assign story points to user stories based on their complexity, effort, and potential impact. By estimating the story points for each task, teams can gauge the overall workload for a sprint and use Velocity as a benchmark for future planning.
1.3- Ideal Days and Time-Based Metrics:
Some Agile teams prefer a time-based approach, using “ideal days” or hours to measure Velocity. This method involves estimating the time it would take to complete each task without accounting for interruptions or external factors. While less abstract than story points, this approach requires careful consideration to avoid micromanaging.
1.4- Capacity Planning and Team Consensus:
Measuring Velocity isn’t a one-size-fits-all process. Agile teams often engage in capacity planning sessions where team members collectively determine their capacity based on their expertise, historical performance, and potential obstacles. This collaborative approach fosters a sense of ownership and aligns the team’s expectations.
1.5- Tracking Historical Data:
To refine the measurement of Velocity, Agile teams rely on historical data. By analyzing past sprints, teams can identify patterns, understand their average Velocity, and make informed adjustments. This iterative process allows teams to continuously fine-tune their estimations and enhance their predictive accuracy.
1.6- Adaptation and Continuous Improvement:
The beauty of measuring Velocity lies in its adaptability. Agile principles encourage teams to inspect and adapt their processes continually. By regularly reviewing and adjusting their Velocity measurement techniques, teams can stay agile, respond to changing circumstances, and foster a culture of continuous improvement.
1.7- Conclusion
Velocity is more than just a metric; it’s a compass guiding Agile teams toward success. By exploring various measurement approaches, from story points and time-based metrics to capacity planning and historical data analysis, teams can harness the power of Velocity to optimize their workflows, set realistic goals, and navigate the complex landscape of Agile development with confidence. As teams embrace the flexibility and adaptability inherent in Agile methodologies, the measurement of Velocity becomes a dynamic tool for continuous improvement and sustained success.
2- Sprint Burndown: Ensuring Timely Delivery
In the dynamic landscape of Agile development, ensuring timely delivery is paramount. Sprint Burndown, a pivotal Key Performance Indicator (KPI), plays a crucial role in this pursuit.
2.1- Understanding Sprint Burndown:
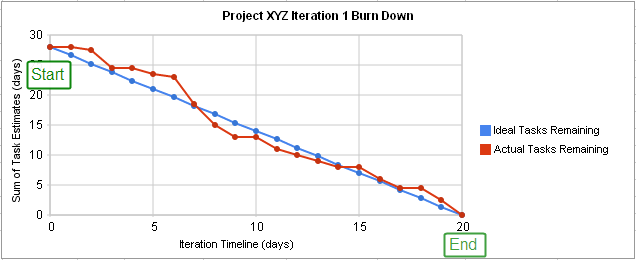
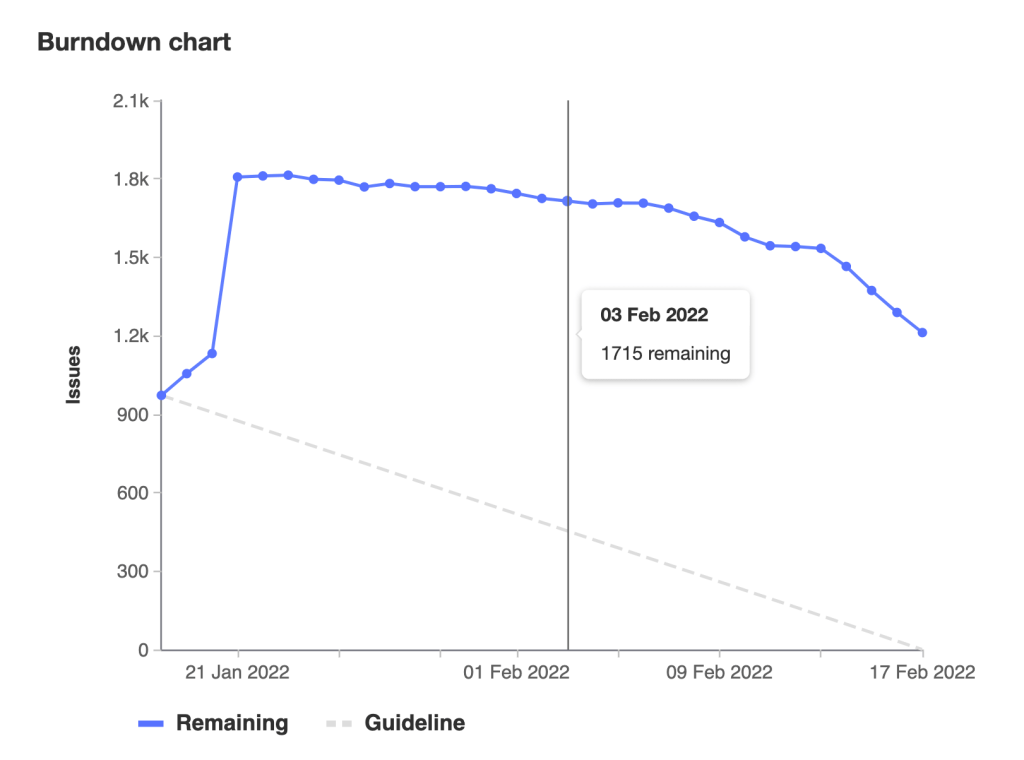
it’s essential to grasp the concept of Sprint Burndown. This KPI visualizes the progress of work throughout a sprint, depicting the remaining effort against time. It serves as a real-time compass for teams, guiding them toward the completion of sprint goals and highlighting potential challenges that may hinder timely delivery.
2.2- Measuring Sprint Burndown:
- Use of Burndown Charts:
- The most straightforward and commonly used method is through Burndown charts.
- These visual representations track the amount of work remaining over the course of the sprint. Agile teams update these charts regularly, allowing for a quick assessment of progress and enabling timely adjustments if the project is veering off track.
- Data-Driven Tracking Tools:
- Agile teams often leverage project management and tracking tools that automate the measurement of Sprint Burndown.
- These tools generate real-time graphs and charts based on the input and progress updates provided by team members. This automated approach not only saves time but also enhances accuracy in monitoring the sprint’s trajectory.
- Daily Stand-ups and Team Collaboration:
- Effective communication is key in Agile methodologies. Daily stand-up meetings provide an opportunity for team members to discuss progress, impediments, and updates on Sprint Burndown.
- By fostering collaboration and transparency, teams can collectively address challenges and ensure everyone is aligned toward the common goal of timely delivery.
- Integration with Work Item Tracking:
- Integrating Sprint Burndown metrics with work item tracking systems provides a comprehensive view of how individual tasks contribute to the overall progress.
- This level of granularity enables teams to identify specific areas that may require additional attention or resources to maintain the sprint’s pace.
2.3- Benefits of Measuring Sprint Burndown:
- Early Issue Identification:
- Regularly measuring Sprint Burndown allows teams to identify potential issues early on.
- Whether it’s unexpected obstacles, scope changes, or resource constraints, prompt identification empowers teams to address challenges before they escalate.
- Facilitates Informed Decision-Making:
- Access to real-time data from Sprint Burndown charts equips Agile teams with the information needed to make informed decisions.
- This ensures that adjustments can be made promptly, optimizing the team’s chances of meeting sprint goals within the allocated time.
2.4- Conclusion
In the Agile world, where adaptability and efficiency are paramount, measuring Sprint Burndown is not just a routine task; it’s a strategic necessity. By implementing these measurement strategies, Agile teams can harness the power of Sprint Burndown to steer projects towards timely success, ensuring that delivery targets are not only met but exceeded. Embrace these approaches, and watch as your Agile endeavors flourish with punctuality and accomplishment.
3- Lead Time and Cycle Time: Streamlining Workflow Efficiency
Agile teams thrive on adaptability and efficiency, and two key metrics play a pivotal role in achieving these goals: Lead Time and Cycle Time.
3.1- Understanding Lead Time:
Lead Time is the total duration it takes for a work item, typically a user story or task, to move from initiation to completion. Measuring Lead Time involves capturing every stage of the development process, from the moment a task is added to the backlog to the point when it is considered done.
- Initiation Phase: The clock starts ticking when a new task is identified, and its details are added to the product backlog. This phase involves defining the requirements and ensuring clarity before active development begins.
- Active Development: Lead Time includes the time spent actively working on the task. This phase covers coding, testing, and any necessary revisions.
- Review and Testing: Once the development work is complete, the task undergoes a review and testing phase. Lead Time encompasses the time spent in these crucial stages to ensure the quality of the deliverable.
- Completion: The Lead Time calculation concludes when the task is considered complete and ready for deployment.
3.2- Understanding Cycle Time:
Cycle Time, on the other hand, focuses specifically on the time a task spends in active development. Unlike Lead Time, Cycle Time excludes the time spent waiting in queues, review phases, or any other non-active development stages.
- Active Development Duration: Cycle Time begins when the team starts actively working on a task and ends when the development work is finished.
- Exclusion of Wait Times: Unlike Lead Time, Cycle Time doesn’t consider the time a task spends waiting for review, testing, or deployment. It narrows its focus to the core development activities.
- Immediate Feedback: Measuring Cycle Time provides immediate feedback on how efficiently the team is progressing through active development tasks, allowing for quick adjustments and optimizations.
3.3- Why These Metrics Matter:
- Identifying Bottlenecks: Lead Time and Cycle Time metrics help Agile teams identify bottlenecks and inefficiencies in their processes. Prolonged lead or cycle times may indicate areas for improvement in the workflow.
- Optimizing Workflows: Armed with insights from Lead Time and Cycle Time measurements, teams can optimize their workflows to reduce delays and deliver value more rapidly.
- Predictability: These metrics contribute to project predictability, allowing teams to estimate delivery times more accurately and make informed commitments to stakeholders.
3.4- Conclusion:
In the world of Agile, where adaptability and efficiency reign supreme, Lead Time and Cycle Time emerge as crucial metrics for success. By meticulously measuring the duration from task initiation to completion and focusing on active development timelines, Agile teams can enhance their workflows, identify opportunities for improvement, and ultimately deliver projects with precision and agility.
4- Cumulative Flow Diagram (CFD): Visualizing Workflow Dynamics
In the dynamic landscape of Agile project management, Cumulative Flow Diagrams (CFD) have emerged as powerful visual tools that provide insights into workflow dynamics. These diagrams offer a comprehensive snapshot of work items as they progress through various stages of the development process.
4.2- Understanding Cumulative Flow Diagrams (CFD):
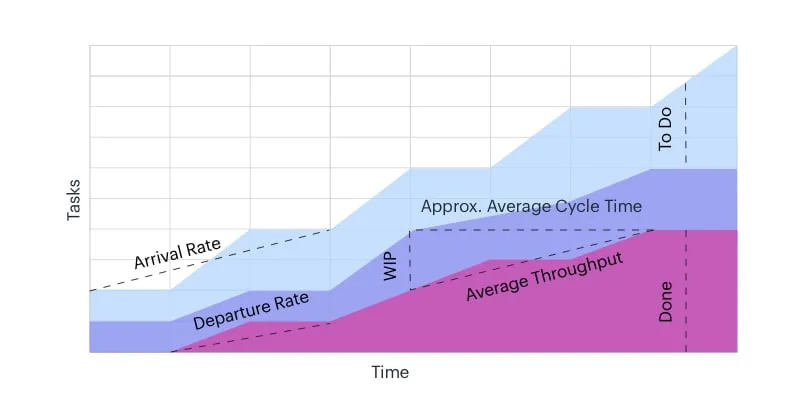
Before we dive into measurement metrics, let’s briefly understand what CFDs are. These visual representations showcase the flow of work items over time, depicting how tasks move through different stages – from backlog to completion. CFDs are invaluable for identifying bottlenecks, tracking work in progress, and making data-driven decisions.
4.3- Lead Time and Cycle Time:
Two fundamental metrics closely associated with CFDs are Lead Time and Cycle Time. Lead Time measures the total duration of a work item, from the moment it’s introduced to when it’s completed. Cycle Time, on the other hand, focuses on the active development phase. Both metrics contribute to the overall understanding of the efficiency and speed of the development process.
4.4- Work in Progress (WIP) Limits:
CFDs often incorporate Work in Progress (WIP) limits, indicating the maximum number of tasks allowed in each stage of the workflow. By measuring and adhering to WIP limits, Agile teams can prevent overloading, reduce multitasking, and maintain a steady flow of work items.
4.5- Flow Efficiency:
Flow Efficiency is a metric derived from CFDs that measures the time a work item spends in an active, productive state versus the total lead time. It provides insights into how effectively a team is progressing tasks through their workflow stages, enabling continuous improvement.
4.6- Identifying Bottlenecks and Constraints:
CFDs are powerful tools for identifying bottlenecks and constraints within the workflow. By examining the flow of work items through different stages, teams can pinpoint areas that impede progress and take corrective actions to optimize their processes.
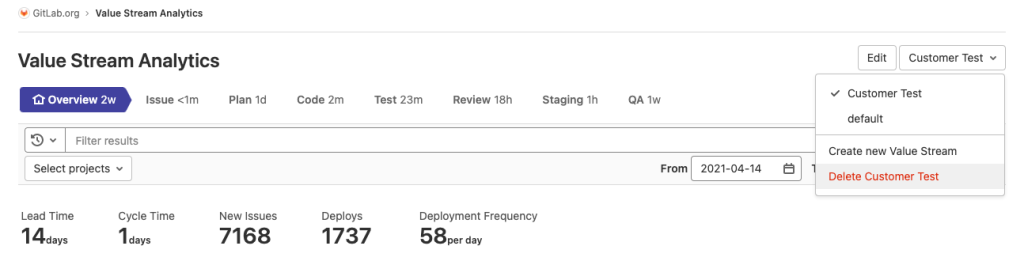
Use Gitlab value stream analytics to identify:
[6]
- The amount of time it takes to go from an idea to production.
- The velocity of a given project.
- Bottlenecks in the development process.
- Long-running issues or merge requests.
- Factors that cause your software development lifecycle to slow down.
4.7- Trend Analysis:
Continuous measurement and analysis of CFDs over time allow teams to identify trends and patterns. Understanding how the flow of work items evolves helps teams make informed decisions, predict future challenges, and continuously refine their workflows.
4.8- Conclusion:
In the intricate world of Agile project management, Cumulative Flow Diagrams serve as navigational tools, providing teams with a visual representation of their workflow. By measuring key metrics such as Lead Time, Cycle Time, WIP Limits, Flow Efficiency, and conducting trend analysis, Agile teams can harness the power of CFDs to optimize their processes, enhance productivity, and ultimately drive success in their projects. As we continue to embrace the principles of agility, understanding and leveraging these measurement techniques will undoubtedly contribute to achieving and maintaining project excellence.
5- Backlog Health: Ensuring Prioritization and Alignment
In the realm of Agile project management, the health of the product backlog is paramount to the success of a team. A well-maintained and strategically organized backlog ensures that teams are focused on delivering maximum value.
5.1- Backlog Grooming Frequency: The Rhythm of Prioritization
Regular backlog grooming is akin to the heartbeat of Agile development. Teams measure the frequency of backlog grooming sessions as a vital indicator of Backlog Health. The more consistently teams groom their backlog, the better they can adapt to changing priorities and ensure that the backlog remains a true reflection of current project needs.
5.2- Number of Items: Balancing Quantity and Quality
The sheer number of items in the backlog is a straightforward metric but carries significant weight. A bloated backlog may indicate inefficiencies, making it essential to strike a balance between having enough user stories or tasks to work on and avoiding unnecessary clutter.
5.3- Prioritization Effectiveness: Aligning with Business Goals
The effectiveness of backlog prioritization is a key measure of how well a team aligns its efforts with overarching business goals. Teams need to assess whether the most crucial and high-priority items are consistently placed at the top of the backlog, ensuring that the work being tackled aligns with strategic objectives.
5.4- Aging of Backlog Items: Preventing Stagnation
Just like fine wine, backlog items should not be left to age indefinitely. Teams monitor the aging of backlog items to prevent stagnation. An aging backlog might indicate unresolved issues or a lack of clarity, prompting teams to revisit and refine items to keep the pipeline flowing smoothly.
5.5- Dependencies and Relationships: Mapping the Landscape
Backlog Health extends beyond individual items; it involves understanding the relationships and dependencies between them. Teams measure the clarity of these connections to identify potential roadblocks and ensure that tasks are sequenced in a logical and efficient manner.
5.6- Engagement of Stakeholders: Fostering Collaboration
The involvement of stakeholders in the backlog refinement process is a key indicator of Backlog Health. Teams gauge how well stakeholders are engaged in providing feedback, insights, and updates. Effective collaboration ensures that the backlog remains a living document that accurately reflects evolving project requirements.
5.7- Conclusion:
Measuring Backlog Health in Agile teams is a multifaceted process that involves a careful analysis of various metrics. By regularly assessing grooming frequency, the number of items, prioritization effectiveness, aging, dependencies, and stakeholder engagement, teams can ensure that their backlogs remain agile, adaptable, and aligned with business objectives. As we navigate the intricate landscape of Agile project management, understanding and optimizing Backlog Health emerges as a crucial aspect of fostering collaboration, maintaining efficiency, and ultimately achieving success.
6- Release Burndown: Tracking Progress Across Iterations
In the ever-evolving landscape of Agile methodologies, successful project management hinges on effective measurement and adaptability. One such key metric that plays a pivotal role in steering Agile teams towards their goals is the Release Burndown.
6.1- Understanding Release Burndown:
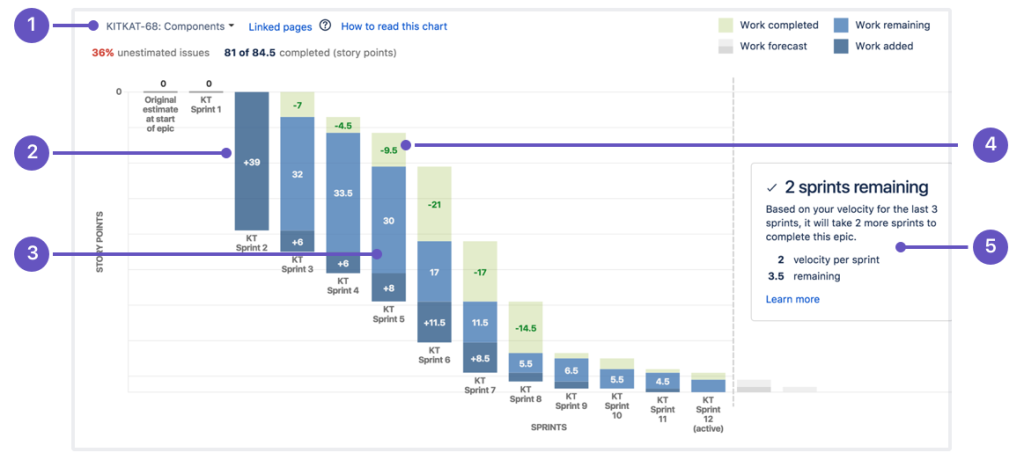
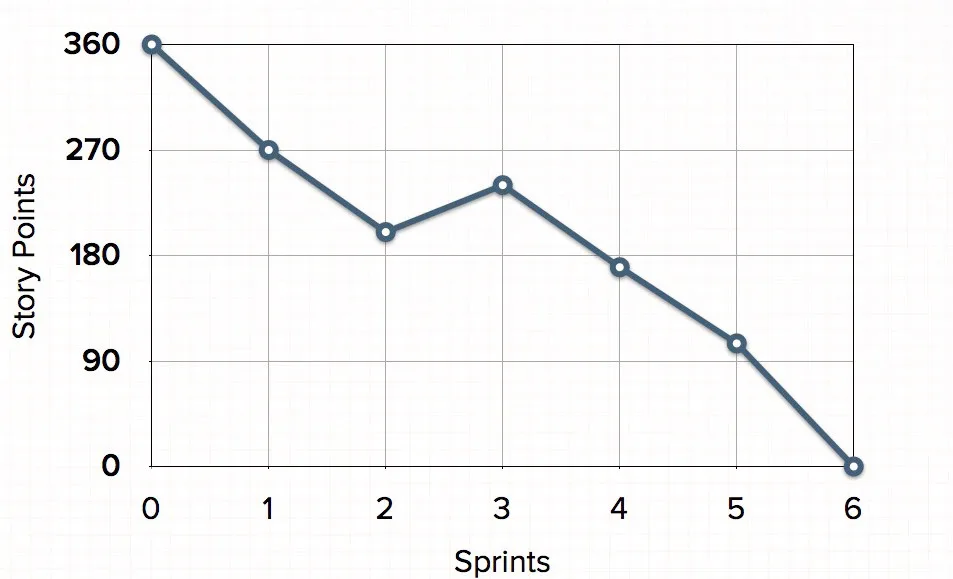
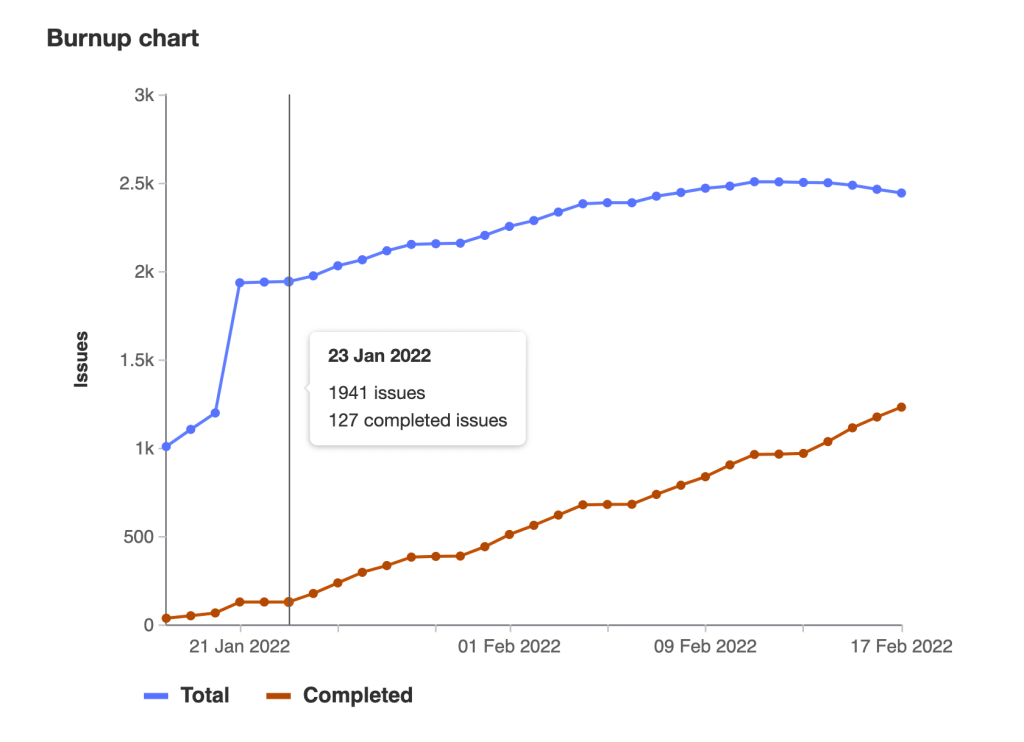
Before we delve into the measurement aspects, let’s first grasp the essence of Release Burndown. This metric provides a visual representation of the work completed versus the work remaining in a project, spanning multiple sprints or iterations. By tracking this data over time, teams gain insights into their progress towards achieving overarching release goals.
6.2- Ways to Measure Release Burndown:
1. User Story Points or Task Count:
Agile teams often measure Release Burndown using user story points or task count. The chart tracks the completion of user stories or tasks against time, giving teams a clear picture of how well they are progressing towards their release objectives.
2. Daily Updates:
Regular updates are essential for an accurate Release Burndown chart. Agile teams often update the chart daily, reflecting completed work and adjusting the remaining work based on the team’s ongoing assessments. This real-time visibility allows for quick decision-making and adjustments as needed.
3. Ideal Burndown Line:
Agile teams often establish an ideal burndown line, representing the optimal pace at which work should be completed to meet release goals. Deviations from this line can serve as early indicators, prompting teams to assess and address potential challenges or delays.
4. Task Board Integration:
Integrating the Release Burndown with the team’s task board provides a seamless flow of information. As tasks are completed or updated on the board, the Release Burndown chart reflects these changes, offering a comprehensive and synchronized view of progress.
5. Regular Retrospectives:
Release Burndown measurement is not just about the numbers; it’s also about continuous improvement. Regular retrospectives provide teams with the opportunity to reflect on their performance, identify areas for enhancement, and refine their approach for future iterations.
6. Communication and Transparency:
Effective communication and transparency are crucial in Release Burndown measurement. Teams should openly discuss progress, challenges, and potential roadblocks. This ensures that everyone involved has a clear understanding of the current status and can collaborate to overcome obstacles.
6.3- Conclusion:
Release Burndown is a powerful tool in the Agile toolkit, providing teams with a visual roadmap towards successful project delivery. By adopting effective measurement practices, teams can not only track their progress accurately but also proactively address challenges, make data-driven decisions, and ensure that their projects align with business objectives. As Agile methodologies continue to shape the future of project management, mastering the art of Release Burndown measurement becomes paramount for teams aspiring to navigate the complexities of software development with agility and precision.
Summary
In conclusion, the journey to success in Agile environments is paved with the effective utilization of Key Performance Indicators. By harnessing metrics like Velocity, Sprint Burndown, Lead Time, Cycle Time, Cumulative Flow Diagrams, Backlog Health, and Release Burndown, Agile teams can not only measure their performance but also continuously adapt and improve. These essential KPIs serve as beacons, guiding teams toward optimal productivity, streamlined workflows, and successful project delivery in the ever-evolving landscape of Agile development.
References:
[1] “What Are Agile KPI Metrics? | Wrike Agile Guide,” Wrike.com, 2023. Available: https://www.wrike.com/agile-guide/faq/what-are-agile-kpi-metrics/. [Accessed: Jan. 04, 2024]
[2] Wikipedia Contributors, “Burndown chart,” Wikipedia, Aug. 21, 2023. Available: https://en.wikipedia.org/wiki/Burndown_chart#/media/File:Burn_down_chart.png. [Accessed: Jan. 04, 2024]
[3] “The Complete Guide to Cumulative Flow Diagram,” Kissflow.com, Mar. 03, 2022. Available: https://kissflow.com/project/agile/guide-to-cumulative-flow-diagram/. [Accessed: Jan. 04, 2024]
[4] M. Cohn, “Release Burndown Chart,” Mountain Goat Software, 2024. Available: https://www.mountaingoatsoftware.com/agile/scrum/scrum-tools/release-burndown. [Accessed: Jan. 04, 2024]
[5] “Burndown and burnup charts | GitLab,” Gitlab.com, 2024. Available: https://docs.gitlab.com/ee/user/project/milestones/burndown_and_burnup_charts.html. [Accessed: Jan. 04, 2024]
[6] “Value stream analytics | GitLab,” Gitlab.com, 2024. Available: https://docs.gitlab.com/ee/user/group/value_stream_analytics/. [Accessed: Jan. 04, 2024]
[7] Atlassian, “Learn burndown charts with Jira Software | Atlassian,” Atlassian, 2024. Available: https://www.atlassian.com/agile/tutorials/burndown-charts. [Accessed: Jan. 04, 2024]
[8] Broken Build, “Agile Velocity Chart Gadget,” Atlassian Marketplace, Aug. 18, 2016. Available: https://marketplace.atlassian.com/apps/1215768/agile-velocity-chart-gadget/?tab=overview&hosting=cloud. [Accessed: Jan. 04, 2024]